
A global building materials group needs a sales forecast from ten operating companies every week. The teams used to extract the data from CRM, ERP and reporting systems and consolidate it by hand within a short weekly window. In one week, we built an automated data flow on Data360 Analyze. It combines four sources, including an AI model that calculates the forecast from historical data and continuously updated inputs, takes the working calendar into account and prepares ten weekly reports. Local teams review and approve the forecast before it is uploaded to the reporting tool. By our estimate, this saves around three to four people’s Monday mornings every week.
10
operating companies
10
weekly reports, generated automatically
1 week
to build the solution
3–4
people’s Monday mornings saved every week (estimate)
The challengeFragmented workflows, a short weekly window
- Every week, the operating companies extracted large volumes of data and consolidated them by hand, within a short window.
- CRM data was not integrated with ERP general ledger balances or with the static reporting systems.
- The figures needed cross-system enrichment and manual validation before they could be reported.
Project facts
- Client: global building materials group
- Process: weekly sales forecast
- Scope: 10 operating companies, 10 weekly reports
- Sources: CRM, ERP (Epicor; the data flow works with any ERP), the ExQL reporting tool and an AI forecasting model
- Product: Data360 Analyze
- Frequency: every week
- Time to value: 1 week
The solutionOne automated data flow, from collection to report
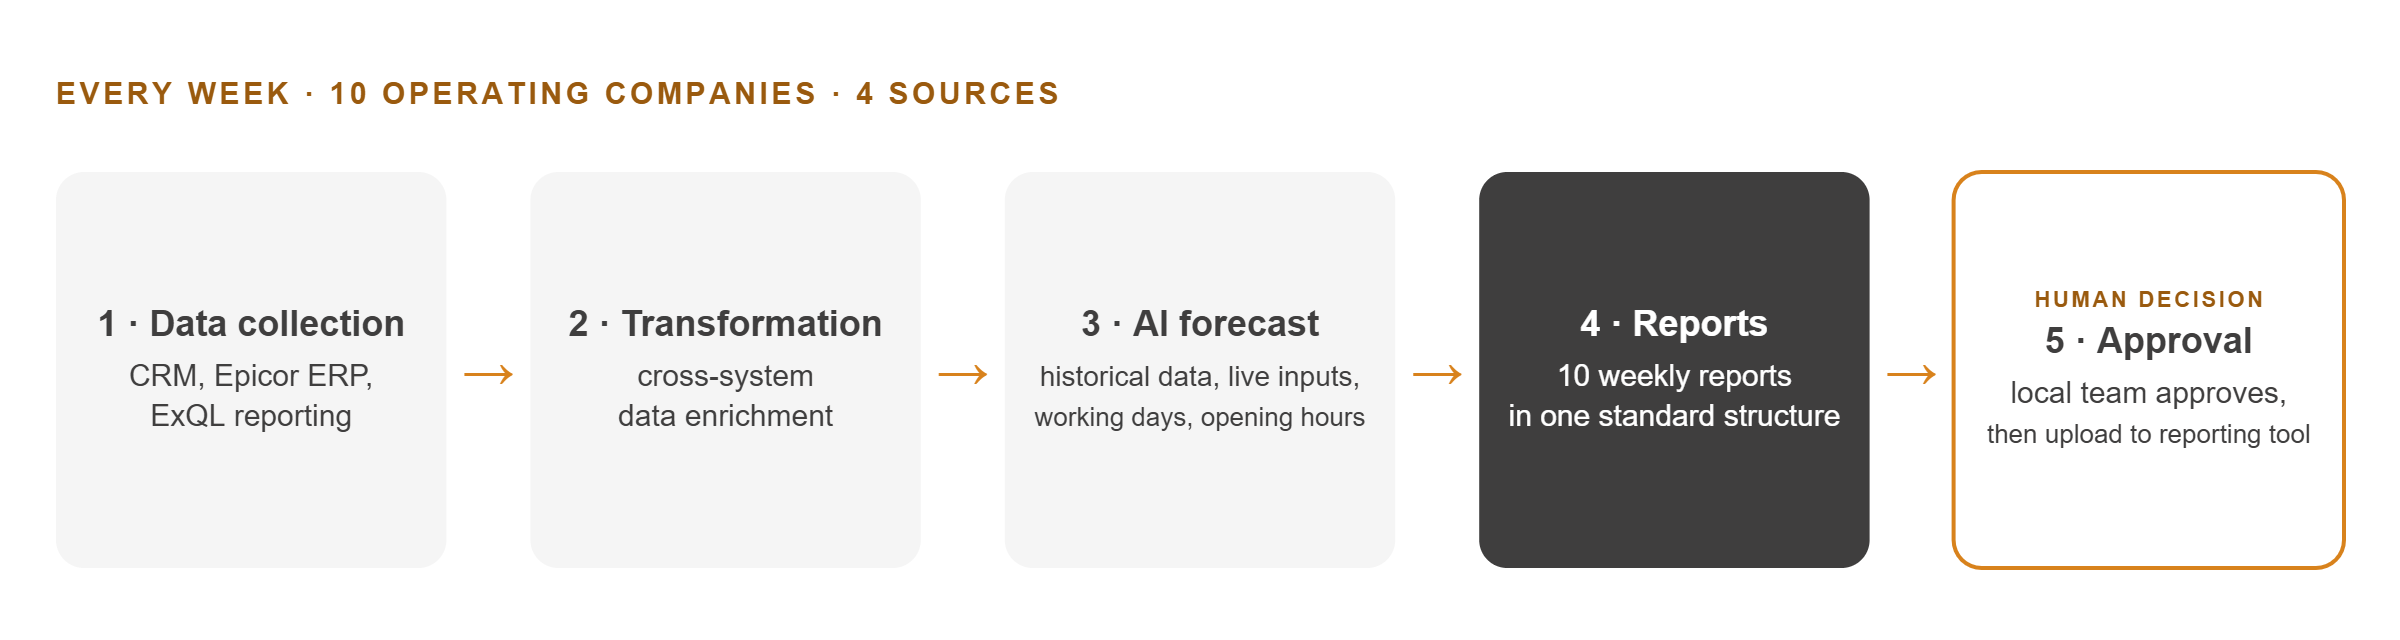
An automated data collection and transformation workflow aggregates the inputs from the CRM, the ERP and the ExQL reporting tool. An AI model calculates the forecast value from historical data and continuously updated inputs, and the calculation takes the operational calendar into account, such as weekly business opening hours and the number of working days. The data flow works with any ERP; at this client, it runs with Epicor.
Local teams keep the final say: the forecast is uploaded to the reporting tool only after their review and approval.
Key functionalities
End-to-end automation
The whole forecasting process, from data collection to report generation, runs automatically. Fragmented manual steps are gone.
Manual override, full control
Local teams keep control. The final forecast is uploaded to the reporting tool only after explicit human review and approval.
Accuracy that improves over time
The AI model works from historical data and continuously updated inputs, so forecast accuracy increases over time as the history grows.
Business valueWhat changed for the operating companies
- Hours saved every week. Around three to four people’s Monday mornings, every week, with no manual data collection, transformation or reconciliation.
- More reliable forecasts. Accuracy keeps improving over time, and variances shrink.
- Time for higher-value work. While the data flow runs, the team works on analysis and planning.
- No dependency on IT during the weekly run. Reports are generated without external teams, local database administrators or IT support.
- One standard for leadership. The same reporting structure across all entities: clean, auditable, a single source of truth.

Behind this storyThe solution, the product and the service
SolutionData Flow Automation
ProductData360 Analyze
ServiceSolution Design & Implementation
Want results like these? Talk to an expert.
ContactTalk to an expert
Tell us which SAP process or product you are looking at. One of our consultants will get back to you.
- We read your message and pass it to the consultant who knows the topic.
- We contact you to agree on a short call.
- If you wish, we show a demo on a process like yours.
Prefer to write directly?
info@novacon.hu
